Showing posts with label Business Intelligence. Show all posts

2014-03-16

Business Intelligence agility, system & organisation


If you follow the data warehouse  tweets, you may have noticed there are often failed jobs in the job statistics. It is actually worse than what you see, jobs which never start due to failing prerequisites is not registered, e.g. a necessary source system job ends unsuccessfully. Still very seldom this is a problem since we only have a production environment, most tests are also run in the production environment, and the majority of failed jobs are tests. You should turn off logging when you test, but who remembers that? And who cares?

In an ERP system landscape it makes sense to have separate testing and production environments for very obvious reasons.You never want to put a transaction or program of any kind into ERP production without proper testing, since ERP transactions often updates the database and it is very hard to test and debug ERP transactions in an everchanging ERP environment. In a test environment you can set up your own scenarios and test the transactions without the risk of other updating your test data. There is also a security aspects, e.g. no sane owner of an application register financial transactions would grant ‘free’ access to developers into the production environment. Thus it makes sense to set up a permanent test environment for ERP systems which also is a good a playground for user training.

For BI or Data Warehouse applications the situation is different, most transactions are read-only (most updates are done in controlled and relatively static batches) and debugging is very hard without current production data. Since the data is stable testing can preferably be done in the the production environment. More important agility is key in BI. Developing directly in production (together with the user) is much faster when you can see the result in real time, than developing in a test environment. I question if you can develop together with users in a test environment at all. Anyway agile it is not. When you need to test updating programs you create a personal mart or take a snapshot, that is one of the key features of a Data Warehouse. And then you test in your mart or snapshot. You need plenty of disk-space for this (and easily accessible backups, for fast restore when you screw up). What use are good data mart facilities if you cannot use them?

If you develop in a separate environment, do not develop together with users, if you as a developer cannot create data marts and/or snapshots on the fly or do not have simple access to backups; you do not have agile Business Intelligence, no matter what your BI vendor says.

There is yet another aspect that can aggravate the agility of the BI, the development methodology. In ERP requirements and program specifications are good things, but in BI specifications other than very high level are evil.
If you develop according to the ERP specification model it is very likely you do not have Business Intelligence at all, it is more likely you are doing standard reporting.


‘When I want a new analysis of stock movements since 2006 I want it in hours not tomorrow. I do not necessarily care about 100% veracity, I care about velocity!’
A Data Warehouse user.


It’s not only the BI system, it is very much your BI organization that determines to what degree you are agile.


The loophole:

The observant reader may have seen a flagrant loophole in this post,  ‘the security aspect of BI development‘. Shouldn’t the BI developer be kept out of the production environment?
I argue you cannot keep the BI developer away from the production data, since debugging and testing often is very hard and sometimes almost impossible without access to production data. There are situations where you cannot allow the developers access to the production data, but then you will not have a very agile BI system. You have to trust the BI developer if you want speedy agile BI systems, and accept the fact the BI developer knows more about the business than they maybe should. 
Business Intelligence developers should sign an agreement of non disclosure.

2014-01-25

The Data Warehouse goes YouTube


For some time now (6 years) I been pondering upon how to visualize the Data Warehouse.  Lately I been inspired by Derick Rethan’s fantastic OpenStreetMap year of edits.

I started by download zillions of software to be able to create ‘activity images’ of the Data Warehouse. I actually managed to create some png frames based on job logs but to do what I wanted I realised it would take just to much of my time  so I stopped. Then I remembered I had seen an animation of web logs some years ago I googled but didn’t find anything. Then I asked  Andreas if he knew about this animation. ‘Yes you sent me a link about this some years ago check out Logstalgia, I send you the link’.

After downloading another shitload of software I had Logstalgia up and running. It didn’t do what I had in mind, but the visualization Logstalgia does is cool, and t is so much easier to animate the logs this way. First I created a pong-event for each entry in the Data Warehouse job logs. I started at CET 18:00 20140115 and ended the next day at 18:00. One day in the Data Warehouse starts at 18:00 by some house cleaning after the backup snapshot is taken. At about 19:00 data loading for our Japanese plant starts. At midnight loading of the other Data Warehouses starts and job activity peaks around 04:00 - 05:00.
At about 08:00 in morning of 2014-01-15, the Data Warehouse and Qlikview users start coming in and the pattern changes. I think this video is worth viewing in it’s entirety.

I had to ‘time compress’ the jobs otherwise the video had been all too long. All jobs started is seen as a pong-ball in the video, the job bounces as a green success or a red failed.
After the jobs I inserted MySQL slow-query log. These entries are marked slow-query and these pong-balls  bounces with the query time in red like 10.05. Slow queries in a Data Warehouse are likely to happen. If you allow users in creating their own jobs and adhoc reporting joining large tables via Excel and Query you have lot’s of slow queries. As long as they do not affect other too much we do not mind.
Next I inserted MySQL general log. This was more problematic. I could not show all queries there were some six million queries that day, I picked all connects but they were too many, I removed all connects from jobs, leaving connects from Excel users, each connect pong-ball bounces with a blue connect.
Finally I inserted Qlikview session start from Qlikview log. This was a horror, the qlikview log is not meant to be parsed by a bash-script, I hand edited this log with the Kate-editor. The Qlikview pong-balls bounces with a green session.

Then I created the video by piping the ‘log-pong’ to ffmpeg:
logstalgia -s 8 --hide-paddle -g "DATAWAREHUSE,URI=mysql?$,1" -800x480 --output-ppm-stream - ~/logstalgia15.txt | ffmpeg -y -r 25 -f image2pipe -vcodec ppm -i -   -pix_fmt yuv420p -crf 1 -threads 8 -bf 0 logstalgia.mp4
Once again the result can be seen at http://youtu.be/bTY9IgJd8kA.
I did some mistakes along the way. First was to start a 18:00 this caused lots of extra work most notably with Qlikview since these logs are organised in dates. Second I used Bash-scripts instead of PHP or any other decent programming language.

This might look like it was easy, but for me as a complete ‘video newbie’, it was not easy, just to make this log-pong flow look reasonably well took a long long time. I’m very happy with the result.

At last the Music; at first I had Verdi’s Thriumpal March in mind but it was to short, so I picked Beethoven’s Final of Eroica instead, not a bad substitute.

2013-12-21

Business Intelligence, the future and beyond

Just a few days after I wrote this post I received a mail promoting a new BI system from one of the big guys.

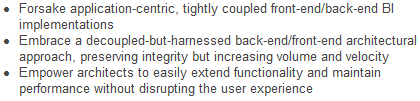
Excerpt from the admail.

The first two items are almost identical with two sentence I wrote in a document describing my Data Warehouse some ten years ago. I didn’t wrote anything about harnessed though, and  I used the phrase system centric as opposed to my user centric Data Warehouse. And for the last sentence I more than once been baffled by design patterns disrupting the user experience when loading data.
I think this new modern Business Intelligence approach is the way to go, it’s the future and it’s my old Data Warehouse design.

2013-12-15

Some Data Warehouse

I am writing a serie of posts about parallel processing of computer background workflows  in general, and more specific how I  parallel process workflows with my Integration Tag Language ITL . ITL is not a real computer language, it doesn’t generate executing code, it only process  a parse tree, nonetheless it passes for a language in a duck test. I can use ITL  to describe and execute processes and I’m happy with that. Some computer systems I created have been labeled ‘not real’ by others, I don’t mind. Once I created the fastest search engine there was in the IBM Z-server environment, it was labeled (by a competitor) not a real search engine. It was a column based database with bitmap indexes and massively parallel search, it kicked ass with contenders, and I was happy with that. I have created a Data Warehouse, it has also been labeled not a real Data Warehouse, it beats the crap out of competitors though, and I’m happy with that. With my XML based Integration Tag Language I can describe and execute complex parallel workflows easier than anything else I have seen, and I’m happy with that too. Interestingly the host language I use PHP, is often labeled not a real language. PHP a perfect match for ITL, it’s so not real.

Not a real Data Warehouse

My not real Data warehouse has a rather long history, it started around 1995 when I was working as a Business Intelligence Analyst. I got hold of a 4Gb harddisk for my PC, I realised I could fit a BI storage on this huge  disk. At that time I had read a lot about the spintronic revolution that was about to come with gigantic disks, RAM  and super processors to ridiculously low prices. I started to play with the idea of building a future BI system, where you do not have squeeze data onto the disks, where large portions of data could reside in RAM and be parallel processed by many processors.

Simple tables, no stupefying multi dimensional extended bogus schema

The first thing I did was to get rid of the traditional data models , the normalized OLTP, and the denormalized OLAP models, I was thinking denormalize on a grand scale, each report should have it’s own table from which users could slice, dice and pivot as much they liked in their own spreadsheet (Excel) applications. I called these tables Business Query Sets, since in future we would have oceans of disk space , we could afford to build databases as the normal user perceived them, as tables not multi dimensional extended snowflakes or star or whatever the traditional BI storages are called. Have you ever heard a user ask for reports in extended cube format?

Simple extraction, table based full loads

In future data access will be so fast you can extract entire tables, no more delta loads, I thought. No special extractor code in the source system, just simple SQL on tables. Delta loads are hell, the only thing you can be sure of delta loads break, no matter what you been told delta loads fails. In rare situations you need delta loads, you should have good procedures in place to mend broken delta loads, otherwise you will have a corrupt system. As for having special extractor code in each source system, I would probably not be allowed to put in any extractor code in the source system and you lose control spreading out code all over. Special extractor code was never a clever idea anyway.

Tired of waiting for reports?

It’s fast as hell to select * from table . ‘In future I could trade disk space for speed’ I reasoned. And lots of indexes, it’s just disk space. All frequently used data will reside in huge RAM caches. I also envisioned a Data Warehouse in every LAN, since hardware will be cheap you can have BI servers in every LAN . A LAN database  server is faster than a WAN application  server.  

A user Business Intelligence App, not a Business Intelligence System

Not only did I skip the traditional database models, I also scrapped the System , I wanted to build my Data Warehouse around the users, not build a Data Warehouse System. I wanted to invite users to explore the data with tools of their own choice. I didn’t want to build a System BI the user had to log in to and have funny ‘data explorer’ tools straightjacketed onto them.

2001 a start

Year 2001 I could start build my futuristic Data Warehouse. It wasn’t a start I had wished for. Actually no one in the company believed it was possible to build a Data Warehouse my way. I could not get a sponsor, it was only the fact I was the CIO, with my own (small) budget I could start build my Data Warehouse together with one member in my group. I had to start on a shoestring budget. We used scrapped desktops for servers, with a  new large 100Gb disk, 1Gb RAM and an extra network card. I only used free software. Payback time for the first version was one month. I soon began to design and build my own hardware  and since I used low cost components I could afford large RAM pools and keep much of the frequent data in memory. From a humble start with one user the, Data Warehouse  now produces six to twelve million queries (including ETL) a day, it has about 500 users and feed other applications with data, this includes the BI tool Qlikview . From start 2001 until May 2013 the system only has been down at three power outages. When I moved to corporate IT, the managers of the the product company migrated the Data Warehouse from my two of everything hardware design to single hardware , so now we have to take down the Data Warehouse once a year for service. Twelve years of continuous operation, not many system started 2001 have a track record like that.
For not being a real Data Warehouse, it’s quite some Data Warehouse.
Today I’m very happy for the lack of funds at the start. It forced me to think in directions I probably would not have done otherwise. Another piece of happiness; My colleague I started with was completely ignorant (and unimpressed) of Business Intelligence database theories. The few times I complexed the database design he said ‘I will not do that, I create simple tables it is faster and the users want  tables’. Then I measured the different approaches and his simpler models were always better.

Been there, done that

These days Business Intelligence vendors talk a lot about Big Data , hardware accelerators, in-memory databases, nearly online reporting  etc, I can say with a real pride ‘been there, done that’. I do not say other BI apps are not real, they are real, some really good.
I actually have heard a BI sales representative refer to my Data Warehouse as not real. My Data Warehouse has been called a simple Excel app. I have put in a lot of hard work into my Data Warehouse. Countless nights and weekends of coding, testing and measuring. I’m not happy when the appreciation of all that hard work is ‘a simple Excel app’. On the other hand the feeling of knowing ‘not many people know what I know of Business Intelligence applications’ makes me happy. And now seeing the big guys catching up on ideas I conceived some twenty years ago, makes me real happy.

2013-05-03

New Data Warehouse Servers

I have written some posts about design and build your own BI infrastructure . Now when I’m getting a new assignment, we (my bosses :-) decided I had to replace my hardware  with more professional irons.

The new Data Warehouse

I chose two servers from Dell, o ne PowerEdge R720  and one R720XD , both equipped with one Xeon ES-2609, 32GB 1600MHz RAM and 12TB RAID 6 SATA/Nearline SAS disk space ( I like oceans of space ).

I will use the R720 as a physical MySQL database server , and the R720XD will contain all other (virtual) servers. Going virtual is an architectural change I planned to do for a long time, but I never found the time. I rather would have used my custom build hardware, but the guys who decide decided otherwise. ‘Since you jump ship, we do not dare to use your old computers . We want proper servers.’ I do not know how the new infrastructure will perform but I got a hunch it will perform better than my now old irons. I will also go from 100MB network connections to gigabit, this will definitely speed up communications.

2013-04-03

MySQL 5.6 is out, so what is next?

I just read Simon Mudd’s excellent post MYSQL 5.6 is out, so what is next?  Simon put forth his wish list for MySQL 5.7. Well if Simon can wish so can I. First I think Simons wish list is a good one so I only want to add one wish. Parallel select processing of table partitions . Since my use of MySQL is Business Intelligence applications, I have some large (partitioned) tables that is read many times, so what I really want is faster select processing on large partitioned tables . Another option that could help speed up select on partitioned tables is global partitioned indexes i.e. the index is not partitioned. The MySQL 5.6 key cache support is something I will test out first thing when I have migrated to MySQL 5.6. What is holding me back from migrating is our somewhat odd MySQL setup. I have a MySQL replica  in Japan, which I Rsync with our Master database. First I have to upgrade the Japanese replica and then upgrade the master. The problem is I do not know how to upgrade the Japanese MySQL server. It is an Ubuntu 12.04 LTS standard install, MySQL is the normal Ubuntu package and how to upgrade that from MySQL 5.5 to 5.6? I found this post , but I do not try this on a machine on the other side of the globe on a Linux I only installed once. I do not know Ubuntu procedures but I hope they issue a MySQL 5.6 package for 12.04 LTS. The master MYSQL is run on a Mandriva Linux server where I install MySQL RPM packages myself.    

2013-02-28

Business Intelligence Ping Pong

This morning I had this request from a user.

- I need a list of all materials in our plant with purchase prices. Can you fix that?

- Sure

select matnr, purch_price, currcd for materials

I sent the Excel by mail.

-But I need this for all products with quantity?

- You want a BOM exploded list?

- Yes

- Oki

select

a.product,a.component, a.qty, c.purch_price, c.currcd.

from bom_tree a inner join materials  c

on a.component = c.matnr

order by a.product,a.component

I sent the Excel by mail.

-Hello again, I also need lotsize, can you add that

select

a.product,a.component, a.qty, c.lotsize, c.purch_price, c.currcd.

from bom_tree a inner join materials  c

on a.component = c.matnr

order by a.product,a.component

I sent the Excel by mail.

- This is a nice report, but where is the price in swedish crowns?

- There is no price in swedish crowns.

- I also need the purchase price in swedish crowns using company year currency rate, can you add this?

- Shure

select

a.product,a.component, a.qty, c.lotsize, c.purch_price, c.currcd

,round(coalesce(c.purch_price * d.factor,0),2) as 'PRICE_IN_SEK'

from bom_tree a

inner join materials  c on a.component = c.matnr

left join cur_rate d on d.f_currcd = c.currcd and d.t_currcd = 'SEK' and d.year = '2013' and d.ratetype  = 'ACAB'

order by a.product,a.component

I sent the Excel by mail.

-Hello again, I like the report but I also need unit price. Can you add that?

-Yes

select

a.product,a.component, a.qty, c.lotsize, c.purch_price, c.currcd

,round(coalesce(c.purch_price * d.factor,0),2) as 'PRICE_IN_SEK'

,round(coalesce(c.purch_price * d.factor / c.lotsize,0),2) as 'UNIT_IN_SEK'

from bom_tree a

inner join materials  c on a.component = c.matnr

left join cur_rate d on d.f_currcd = c.currcd and d.t_currcd = 'SEK' and d.year = '2013' and d.ratetype  = 'ACAB'

order by a.product,a.component

I sent the Excel by mail.

- Hello, I really like the report, but I also need the description of the component. Can you add?

-Yes.

select

a.product,a.component, c.descr, a.qty, c.lotsize, c.purch_price, c.currcd

,round(coalesce(c.purch_price * d.factor,0),2) as 'PRICE_IN_SEK'

,round(coalesce(c.purch_price * d.factor / c.lotsize,0),2) as 'UNIT_IN_SEK'

from bom_tree a

inner join materials  c on a.component = c.matnr

left join cur_rate d on d.f_currcd = c.currcd and d.t_currcd = 'SEK' and d.year = '2013' and d.ratetype  = 'ACAB'

order by a.product,a.component

I sent the Excel by mail.

-Hello, now I only need the material overhead for the component?

-???

- If you look into transaction CK11 you find  the overhead in there . Can you add it?

This is what I call BI ping pong , and it is not that bad. I’m playing this match now. We paused for the night, and the SQL in here is not the actual SQL  but a slight transcription for clarity . It is iterative development by interaction and it’s fast. When the user contacted me we were not sure what he wanted, but now at least I have a pretty good idea. And we have not spent many minutes on the development. When I have figured out what the material overhead is, this user will come back and say - ‘I want to compare this report with the figures from last year’. And then we already have a very good, tested and working prototype for the OLAP app the user wanted without anyone of us knowing it from the beginning, (the user actually does not know this yet, but I will suggest a Qlikview app tomorrow).

The conventional (and boring) approach; start a project with lots of eventual users creating demand specifications etc. etc. will take longer time, cost more money and deliver a less satisfactory result.    

2012-12-16

Office activity peaks and Business Intelligence users

Every Database Administrator knows there are work related activity peaks during the day in the office. You have a long peak of activity shortly after most workers arrive in the morning and another shorter one before lunch. After lunch there is an hour of intense activity and a short burst of activity at the end of the day. In between those two peaks not much is happening. How do I measure? In the ERP systems of course, when we work we tend to use the ERP systems, so to measure the work activity rate just calculate the ERP transaction rate. As you may have noticed I’m vague in timings of the peaks. If you have observed activity peaks in different countries you know activity  differs between countries.  I will not mention more about that other than Swedes tend to come in early in the morning, I myself is a bit extreme I often start between 05.30 and 06.00.
A good friend of mine and ex-colleague Ulf Davidsson co-creator of the Data Warehouse used the Business Intelligence system activity to categorise BI-workers into ‘ doers ’ and ‘thinkers ’. The doers start early in the morning and pick up the reports they need for their day tasks. The thinkers tend to come in later their activity peak coinciding with the after lunch peak. The classification into doers and thinkers are quite useful. Doers need precise detailed but rather limited amounts of information in Excel format, while the thinkers are more for quantity ‘give me all, I want all goods movements in all factories since the days of Eden’ and they prefer olap  presentation of the information, today we use Qlikview  for olap visualization. The doers request 100% quality of data, while thinkers demands performance. (The first thinker using the Data Warehouse Styrbjörn Horn  forced me to upgrade the hardware, at the time we were operating on scrapped laptops, ‘I go bonkers while waiting for my reports’. Styrbjörn later founded his own company Navetti .)
A common mistake creating BI is to create the BI for thinkers, since they seldom have detailed knowledge of data, they assume it is correct and when they finally find bad data quality they can be nasty to deal with. When you create a BI application you should find the doers that benefit from the system and start by create reports for them, if they find the reports useful they will help you iron out quality issues. (You should base your BI on solving problems rather than visions and grand ideas.) When the application is stable with correct data it is time to invite the thinkers, if they find your application useful they will help you with the performance issues. Thinkers often have a budget and they can be surprisingly generous if they like your BI system.
This post is based on generalized observations, there are swedish nighthawks and early birds from other countries. We do not only work in ERP and BI systems. BI doers can also be thinkers and vice versa.
I have no connections to those behind the olap video link, I stumbled across it and I like it, especially the brick wall, to create successful BI you must be in the business.
My only connections to Navetti are professional, we use their software and ‘my’ systems feed their software with information.


2012-07-10

Business Intelligence and Hardware

Hardware is often neglected in applications design.  In best cases you divide components of an application into separate servers, move the data to a separate SAN and add some extra RAM for performance and that’s it. The server infrastructure of applications is often well suited for transactional systems. Transactional systems do lot of random read/write of small chunks of data and very little processing on those small chunks.Business Intelligence systems on the other hand does not write very much, but reads a lot. Both reads and writes are mostly done in large chunks.  


Since the middle of the nineties I have been interested in BI applications hardware infrastructure. My interest for hardware started with the   spintronic  revolution, I realized that hard disks (HDD) and memory RAM was going to be larger, faster and cheaper in future. HDD was the first in the spintronic wave. HDD had been too small, too slow and too expensive to allow for modern BI; with the SATA HDD we had cheap, fast and large HDD. The seek time (find the data to read or write) on these cheap SATA HDD is not impressive, so if you need to do lots of small random read/write it is not a wise choice. So the traditional servers still use expensive and small HDD with good seek time.  These HDD are not very good for BI. BI are more interested in low transfer time (from disc into memory) than low seek time, and the SATA protocol can deliver more data than the discs can spin. More important SATA disks today are large, you can get 3 TB SATA disks for about 200€ and size matters for BI operations.  SATA HDD are better suited for BI than more expensive and smaller HDD  found in servers. Of course we will use Solid State Disks in a few years’ time, but still these disks are too expensive and too small for my liking .

Lots of RAM more than compensate for the slower  SATA disks (compared with SAS and SSD),  today you get 24GB SSD3 for about 300€. It is important to have enough of RAM to keep the active data set in memory to keep physical I/O low. Our BI database server needs 16GB to perform well. First day of the month I have noticed increased response times and some ‘peculiar’ MySQL behavior. I will install more memory and see if that helps. If not I have to find the root cause for the increased response times which most likely is missing or not good enough indexes. I still see recommendation about being careful with adding indexes. For BI systems this is wrong, wrong, wrong. You should sprinkle your database with indexes. All frequent queries should have optimized indexes. For the experienced DBA I recommend   Relational Database Index Design and the Optimizers’ by Tapio Lahdenmaki and Mike Leach . This is serious, heavy and good reading about indexes. But I first try to mend performance problems with hardware, it is simpler to add RAM, than to analyze bottlenecks.

Processors today are so powerful any modern multicore processor will do just fine. I use high quality workstation motherboards. For my last database server I used an ASUS P9X79 DELUXE X79 S-2011 ATX motherboard   for about 300€. It performs beautifully for our Business Intelligence system.

With such components it is an easy task to build high performance BI servers. I build the servers as simple as possible, this means I deliberately build them as single-point-of-failure. Simple server means few things that can crash and my servers are remarkably stable. The only things that have crashed so far are HDD raids and raid controllers (two times in eight years). Today disks are so big so we do not need to raid them anymore. Hardware development goes very fast; last year’s top notch hardware is ready for the scrap heap the next year. Using inexpensive servers give me the luxury to replace them more often. The normal lifetime for a server is three years and the life time cycle is test-production-backup-scrap heap. The database server I try to replace more often.

I’m aware of most experts do not approve of my ideas. But I created a working system after these ideas and it performs beautifully. I have put lots of efforts into my system; thinking, testing, measuring. More important than hardware is the database design. I have completely removed the traditional snowflake or whatever it is called design. The traditional BI database design patterns were conceived when hardware were expensive and disks were small. With today’s cheap hardware the old design patterns are a millstone around the BI system’s neck, we will see new simpler databases with more redundancies as in-memory computing becomes a reality. I should probably post about this, since I am an humble pioneer in this field.  

This is how my ‘tin cans’ look 2012-12-23.

2012-05-20

User triggered SAP data loading into a MySQL database from MS Excel

A strategy for real time reporting and loading of Business Intelligence Layer.

From an Excel sheet Button, a signal is sent to a Linux ETL system, that starts a process to fetch ‘delta data’ from a SAP system and update the Business Intelligence data storage in this case a MySQL database.

In a  previous post  I have written about the importance of  performant ETL  processes see   When fast is not enough , you may also want to look at extracting data from SAP  and schedule jobs with PHP . In this post  I will take this  a bit further. Here I show how you can do BI real time reporting with the help of a performant  ETL and Visual Basic in MS  Excel.
The example this post  is based on is a P roof of C oncept and there are still details not fully worked out. But testing so far has been successful.

The merge delta load method

A separate business intelligence (BI) system and real time reporting is easier said than done. Since the BI data is physically separated, there will always be latency, the time it takes to transfer data from the source system to the BI layer. The only way to achieve real time reporting is to do the reporting in the source ERP system. But there are strategies to minimize latency and achieve pseudo online reporting, where the latency is acceptable for the users. Normally you pull data from your source ERP systems at regular intervals, e.g. each night, week or month. To achieve realtime reporting you can increase the pull frequency e.g.  extract data each hour gives  better reconciliation than once a day. However the strain on the computer systems and networks increases with pull frequency and this method does not give online reporting.   The merge delta load method  first fetch data from the BI system and then fetch the delta data from the source ERP system and then merge the two data streams into the report. Although this method gives good real time reporting, there are several disadvantages with this method. It adds complexity to the client, since the client must be able to contact the ERP system and merge the report with ERP delta data. Each time the report is requested the delta data has to be extracted from the ERP system. This means all reports suffer from the response time delay of retrieving data from the source ERP system. Since the BI layer is not updated this delta load is growing with time until next BI layer update.
 
Figure 1a                                                                                                         
Figure 1a shows this scenario. If we now add a user as in Figure 1b we now double the delta extraction from the source ERP system as each user have to fetch the data for his/her report(s).
Figure 1b
With a large number of users this method may extract a lot of data over and over again from the ERP system. If we add another source ERP system as in Figure 1c, this solution becomes very messy. Now the BI client must be able to connect to different source systems and extract and merge all data streams with the base report. The merge delta load method is not very elegant and scales poorly.
Figure 1c

Another approach – user triggered Delta Load

In this example I have  taken another approach to real time reporting.  The merge delta load method is complex and requires special client software to delta load and merges different data streams. Another approach  is to run the ETL process more frequent. But this solution will potentially create a lot overhead by running lots of delta load ETL without any purpose at all. Instead of fire off frequent loads we let the user trigger the ETL. This solves the problem of running lots of meaningless ETL data loads, since we only run the ETL on user request. This way all users benefits from the delta load, data is only extracted once. Instead of retrieving delta data from the source ERP systems, the client sends a signal to the ETL system to start a delta load process  and when the ETL process is finished request the report (see Figure 2a).
 
Figure 2a
This request triggered  update will create a report that is almost real time provided the ETL process is fast. Unfortunately this method requires event based VBA programming in the Excel client, which is currently above the skill level of the author. There is a simple yet elegant way to overcome this technical problem, give the user an update button and let the user trigger the update.  
User triggering simplifies the real time reporting process but the workflow can be depicted the same way as request triggering, the only difference is data extraction from source systems only occur when requested by the user .When we add a user (Figure 2b) we start to see the benefits compared with the merge delta load (Figure 1b).
Figure 2b
No double delta loading since all data extraction updates the common BI layer only once, no matter how many users is added. Adding source systems does not change the picture much, see Figure 2c. We still got a simple and clean real time reporting process.  On the other hand user triggering requires a performant ETL process otherwise the response time will be slow and the report will be old and not real time.  User triggering also requires strict synchronization isolating of individual ETL updates. I will show how I have implemented user triggering for real time reporting.
Figure 2c

User triggered Delta Load  – an   example.

In this example we real time report COPA data from a  SAP system. The reporting is done within an Excel sheet.

The sheet

Figure 3
This is what the user sees when the Excel sheet is invoked. When the user trigger button is pressed a signal is sent to the ETL  to run the delta load  process (see Figure 2a). The ETL status field shows the start, stop and outcome of the last ETL run [1] . The ETL status field is ‘click’ sensitive, click it and the status is updated. In this prototype the ETL process is controlled manually, press the ‘Extract from SAP’ button to fire off the ETL process, click the ‘ETL status’ field to update the status. This is complex real time reporting reduced to a simple, practical and scalable solution. A button and a field    gives the user the power of real time reporting. (There is a lot more to this Excel sheet but that is outside the scope of this post .)

Under the hood

 There is more to it than the button and the field, there are a lot going on under the hood.  The status field is simple, when clicked it just retrieves the status from the ETL system  via a simple ODBC SQL request. The ‘extract’ button is trickier it must contact the   ETL engine which resides in a Linux server and send the signal ‘run Delta Load ’. First we establish a Secure Shell  connection to the Linux server using the Open Source PuTTY program Plink  then we just send the signal ‘run Delta Load’  and disconnect from Linux. The Excel  VBA code  that does the trick can be found in Appendix A.
The Delta Load  procedure is too large to discuss here. In Figure 4 you can see an abbreviated version outlining the job steps.
Figure 4
There is one line of special interest in the procedure, the <prereq type=’singleton’>  restricts the execution of the procedure, it must run alone. If a sibling process already runs this instance dies immediately.  Look at Figure 2 b . If both users send the ‘run ETL’ signal simultaneously one must yield, and this is what this <prereq> does. You can queue the request up by adding a wait to the <prereq>. Since one ETL run will serve all users, it is not necessary to run more than one ETL at a time. This is a very important  simplification, simultaneously updating of large amounts of data is not trivial, and it requires complex logic and slows down the execution.

Response time

The Excel sheet (Figure 3) is a report generator that slices and dices the SAP COPA data. Normally the response time is around one second for generating a report, this is quite a feat since there are a lot of COPA data. This is achieved by ‘in memory computing’. We try to keep data in memory by various caching techniques. When the COPA data is not in memory there may be an initial less than a minute delay [2] .  Since the ETL load time is added to the report response time (if you need an updated report) it is essential to keep the ETL load time low. ETL load statistics (see Appendix B) gives you can normally ETL load 2 to 3 thousand rows in 15 seconds. Two background ETL load jobs a day will keep maximum rows for additional user triggered ETL load below three thousand rows. This is probably a well balanced ETL load scheme. But in the end it is up to user to decide, it is simple to change the ‘background frequency’.

Appendix A – Excel VBA code sends ’run Delta load ’ signal.
Private Sub CommandButton2_Click()
    Dim resVar As Variant
    commspgmP = "C:\Program Files\PuTTY\plink.exe"
    commspgm = """" & commspgmP & """"
    'MsgBox commspgm
    If Dir(commspgmP) = "" Then
        MsgBox "You must install " & commspgmP & " to update BI!" & " http://www.chiark.greenend.org.uk/~sgtatham/putty/download.html"
        Exit Sub
    End If
    hostuser = " -v -l viola -pw xxxxxx DWETLserver"
    cmdtxt = " /home/tooljn/dw/pgm/scriptS.php schedule=COPA_DeltaLoad02.xml logmode=w onscreen=no"
    resVar = Shell("cmd /c " & commspgm & hostuser & cmdtxt, vbMinimizedFocus)
'MsgBox commspgm & hostuser & cmdtxt & "  -  result=" & resVar
    Sleep (2000) ' Sleep for 2 seconds to allow BI update to commence before we...
    Call displayLastUpdate
End Sub
Comments to the code:
This is my first piece of VBA code and I have trial&error it until it worked, I do not know VBA well.
 The line hostuser = " -v -l viola -pw xxxxxx DWETLserver"   is not very elegant. You should  not have hard coded credentials! However in this case it’s benign, the user viola  cannot do anything else but run our ETL process COPA_DeltaLoad02.xml. Going into production this will be replaced by certificates. The user ‘viola’ is in honor of my late and very beloved granny Viola. She was from north of Sweden, her father was chief engineer of the Boden fortress  and an inventor. The German Wehrmacht tried to enlist him, but he declined, which I am grateful for, that made it possible for my grandfather (an orphan with no means from south of Sweden) to meet Viola. He served as a sergeant at the fortress. After marriage and my mother were born he had a motor cycle accident and he was relocated to Stockholm, administrating arms purchase at the Army HQ just 100 meters from my present flat (I’m looking at the building while writing this). I’m grateful for the accident because that made it possible for my father to meet my mother.  At that time he was an accountant, a job now generally replaced by Excel sheets.

Appendix B  - ETL De lta  load times

 The table in Appendix B shows statistics from real ETL runs. Here you can see that the example in this article took 5 minutes and 45 seconds to run and the performance was ~310 rows per second. The load velocity is depended on number of new lines (delta data) , concurrent network load  and the responsiveness of the source (SAP) system . The setup time [3]  is low, normally well below one second.  


To keep average response time acceptable we should probably schedule two back-ground ETL runs a day at 07.00 and noon for the (SAP COPA) data in this example. These ETL runs will have a negligible impact on the infrastructure landscape and keep user triggered loads to a maximum of a few thousand rows.  
Before you schedule the background jobs you should analyze data update pattern i.e. when updates occur and schedule on low activity hours like 07.00 and noon.

[1]  This particular ETL run took some 6 minutes. See Appendix B for details.
[2]  These figures are not measured, it is the authors biased opinion.
[3]  This includes send ‘run ETL signal’ and start up the ETL job in the BI layer. This also includes detection if there is anything to load, this is important you do not want to aggregate nonexistent data and reload already up to date BI cubes.