2014-08-10

Standing on the shoulders of giant mistakes


In some posts I have pointed out other’s blunders. When I see a mistake on system level design I try to remember it, so I do not have to repeat. One such example is return codes. Return codes are numeric values used to signal the outcome of a piece of code e.g. a function. Traditionally return code 0 (zero) means all went well and the higher return code code the less well the piece of code was able to perform. The problem with such return codes, the more values they have the more complex will the interface be, since the receiver of the return code must be able to deal with all values, as long a function is called from one caller only this is not that bad, but when a function is called from several callers this starts to get messy and when the return code scheme is changed it is common not all callers are updated to handle the new or changed return code values, which in the end will trigger erratic behavior. I try to use only two values as return code, 0 (zero) indicate failure, non-zero indicate success. Almost all modern programming languages supports Boolean true/false values and zero is decoded as false while non-zero is true, and I abide by these languages, breaking with tradition making zero signal failure instead of success. This makes my programs simpler and less error prone. I have to translate return codes when calling or being called from external software. Knowing I’m right makes that extra work light. There are situations where the true/false return code values are not enough, one example is the absence of a return code, a null value.    
In IBM’s Job Control Language (JCL) condition codes are return codes signal the outcome of a jobstep. E.g. step 1 in a job ends with condition code 4, step 2 tests for a 0 (zero) condition code which in this case means it will not execute. Now step 3 tests for a 0 (zero) condition code from step 2, which means step 3 expects step 2 run successfully. But in this example step 2 didn’t run, so JCL sets a default 0 (zero) condition code. In JCL a successful execution or no execution at all are both flagged by a 0 (zero) condition code. 
In my job control language ITL, I tackle this problem, allowing to test for bumped over job(steps) plus give an option how to interpret bumped over jobs (success or failure). I consider my ITL language’s return code scheme better than any other job control system I have have seen. This is not because I am better, but because I have had the chance of learning from other’s mistakes.
If you study my works you can learn a lot.

2014-08-05

Patching rfc_read_table

rfc_read_table is a very useful program someone wrote a long time ago, probably some SAP employee. rfc_read_table does what the name implies, it reads tables and it is Remote Function Call enabled, which means you can call it from outside SAP. I found this useful program in 2005, when the company replaced my MRP system with SAP. We (the company) did not have the resources to convert my Data Warehouse to SAP (which I advocated fiercely) at the same time. I realised SAP standard reporting could not be used, if SAP reporting can be said to be structured vertically our marketing department is structured horizontally, actually it is structured both ways. IMHO sap standard reporting is pretty lame. Any road up the Data Warehouse is written in PHP so I looked for a SAP PHP interface and found Eduard Koucky’s SAPRFC and Piers Harding’s SAPNWRFC. After some googling I found rfc_read_table which is excellent for extracting data from SAP systems. Unfortunately rfc_read_table has some glitches and limitations. In the beginning I did some changes to the program to overcome some of the limitations. For some reason SAP do not maintain rfc_read_table, so you have to patch it yourself. (SAP also discourage you from using rfc_read_table.) Years ago I attempted to write an ABAP program rfc_execute_dynamic_sql but I never finished it, probably due to lack of inspiration and due to the fact rfc_read_table covers most of our needs. You can do some nifty things with rfc_read_table and I happen to believe full table extraction is the way to go, yes I know there are some practical issues, but in future when extracting even very large amount of data is done in a blink of an eye delta extracts will be something of the past. (Delta extraction/load should be the last resort and pure table extraction is very natural when you deal with relational data).
rfc_read_table is a very useful program, but it got some glitches even bugs, and lo and behold after all these years we come across one. Packed numerics allocate two bytes to little in the output buffer, or to be correct my version of rfc_read_table allocated two bytes to little in the output buffer, now it’s fixed.


I do not know if it applies to the original version too, but the program did not take into account the decimal delimiter and the trailing negative sign. ISO 11404 prescribes leading negative sign which most of us find quite natural (except financial people, who seem to prefer trailing sign). I did the swapping of trailing to leading negative sign in PHP, a grave mistake from my side, it should have been dealt with directly in rfc_read_table.
That was rather lengthy about patching rfc_read_table.

2014-08-03

PHP 5.6 and a tweet with a graph, final cut.

The 1st of August I wrote this post:
In the previous post I hoped for a nicer monthly graph the 1st of August produced by a daily batch job. I almost delivered! The graph is nicer, but the automatically scheduled job blow up, it looks like there is a problem with the Cron environment.  If you do not follow the Data Warehouse at Twitter I invite you to  at https://twitter.com/tooljn.


This morning I compared the logs from a successful run:


with the failed run:

In PHP version 5.5 I have not linked in necessary software for pChart2, and that is still the PHP version called from the Cron environment. So the fix for this problem is to upgrade to PHP 5.6. As of 2014-07-31 we have PHP 5.6 RC3 and I will plan for this version to go into production in the middle of the month. Follow the data warehouse on twitter, if there is a tweet with a graph 2014-09-01 then we have upgraded to PHP 5.6. There is a hell lot of tests to´run before a PHP version upgrade, I have run PHP 5.6 for some time now, I have not had any problems, the only thing I have noticed so far, PHP 5.6 is faster.

The  development of the monthly graph application was done in the production environment (except for the PHP 5.6 version). Since the application is run once a month the progress calendar time been protracted, but working hours are not many. The current version of the graph application is the final version, it will run in PHP 5.6 and above.

2014-08-01

Tweet with a graph from the Data Warehouse, take 3

In the previous post I hoped for a nicer monthly graph the 1st of August produced by a daily batch job. I almost delivered! The graph is nicer, but the automatically scheduled job blowed up. It looks like there is a problem with the Cron environment.  If you do not follow the Data Warehouse at Twitter I invite you to https://twitter.com/tooljn.

Your pen is leaking!

I’m intending to write a series of posts on development methodology or something similar. Over the years I have come across a load of development methodologies. Most of these make sense one way or another, many emanates from older ones, it’s kind of evolutionary, as it should be. Newer methods tend to be better than older, but at the same time there is nothing new under the sun,  when I read what the true pioneers wrote more than half a century ago about programming I’m baffled over their insights and understanding of programming and software development. But much is also bullshit created by inflated egos trying to make a buck out of baloney.  

In the mid 1980ies I attended a software user conference, one of the attendees was Mr X, he didn’t know the software well and it was clear to me he was there to sell himself and his services. Mr X was political, socializing with managers and software representatives only, he managed to become ‘head’ of the user community for a short period of time. Anyway at this conference Mr X held a presentation about his developing method. The first slide had three defining moments in the history of computers:
  1. 194X The first computer
  2. 196Y IBM’s 360 architecture
  3. 198Z Mr X developing method
Most attendees stopped listening here, I lack a critical mind, so I listened with some enthusiasm but I soon realised there were nothing new or exciting in Mr X presentation and nothing remotely connected to the software we had gathered for, so I also stopped listening after a short while. Then a norwegian software developer tried to interrupt the presentation ‘Mr  X your...’, he was hushed into silence by Mr X, the norwegian developer was all too insignificant for mr X to take notice of. Then I saw what most of us already had seen, there was an ink spot growing just below the chest pocket on mr X shirt, slowly but steadily. By the time the spot was clearly visible to everyone, we were all mesmerized by the growing dark blue spot on the white shirt. No one listen to Mr X and the norwegian guy tried once more ‘Mr  X your...’ and once more he was hushed by Mr X ‘Can you wait until after my presentation with questions, please!’ When the spot was larger than the palm of a hand, the norwegian guy could not hold it back anymore ‘Mr X I think your pen is leaking’. That was the end of the presentation. At the dinner that evening Mr X had a glass to many and never showed up again (as I recall it).

Now when I’m writing about development methods I am aware it might just be pretentious bull. You can judge for yourself when I publish (if I do). But I will read eventual comments with respect no matter who you are.

2014-07-23

Looking for my posts

I recently read a post how to search engine optimize blog posts. I decided to look for my own posts in Google to find out how well my posts were doing in Googles search engine. To my pleasure I found my posts showed up, some even quite high, when I searched for them. But I was a bit saddened to find extracting data from SAP was hard to find, a year ago it was ranked higher but I suppose many posts is written about this subject. (Still I find my post informative, with a practical hands on examples.) By prefixing my search term with 12d (the name of my blog) all my posts I tried showed up, except some data warehouse, no matter how I tried to find it, the post refused to show up in the search result. Other posts of mine showed up, while explicitly searching for some data warehouse but not the post itself. I have checked the post, and I cannot find a reason in the post for not showing up in the search result. The quality is no worse than most of my other posts. No broken links. No explicit language, no controversial anything. It is a mystery to me why the some data warehouse post refuse to show up in the search result.
(Update! I just had to put double quotes around the argument to find my post. There are a lot of "some" + "data" + "warehouse", that is probably the reason why I could not find my post. However the meaning of "some" is different, in the other posts "some" means "unspecified number". I use "some" as in "some chicken", "some data warehouse".)


While searching for my own posts I checked how many have read my posts, and the now not so easy to find extracting data from sap was a clear winner with 736 pageviews, with replicating MySQL with Rsync as the runner up 652 pageviews. Not bad at all, even if many readers was not what I had in mind when I started blogging, it is very rewarding you people out there read my posts. Actually I’m mesmerized by the view stats looking at it almost every day. What I think is a bit sad not more than 30 have read my posts on relational big data, I think they are good and worth some minutes of your time. But what is really think is a pity no more than 14 have read php parallel job scheduling 4. This post shows how to parallel process and rightsize business processes like extraction of data from source systems, a complex and advanced post from a different viewpoint from most writings about parallel processing, which typically deals with speeding up the minute atomic parts of computer programs. The entire serie of parallel workflow processing is worth reading, but I suppose very few are interested in this topic, especially when parallel is done in PHP, so 14 pageviews is maybe not that bad:-)

2014-07-15

Animated graphs from the Data Warehouse

Sometimes, rather often actually I got carried away and have a tendency to overdo things of less importance just for the hell of it. This happen less often now than in my younger days, I guess it has to do with age. This post  is about overdoing.
It started with twitter automation and eye candy. So far so good, but then I got this crazy idea, why not animated eye candy, get the graphics moving. This might not be the most useful feature I have created but it was fun to do.
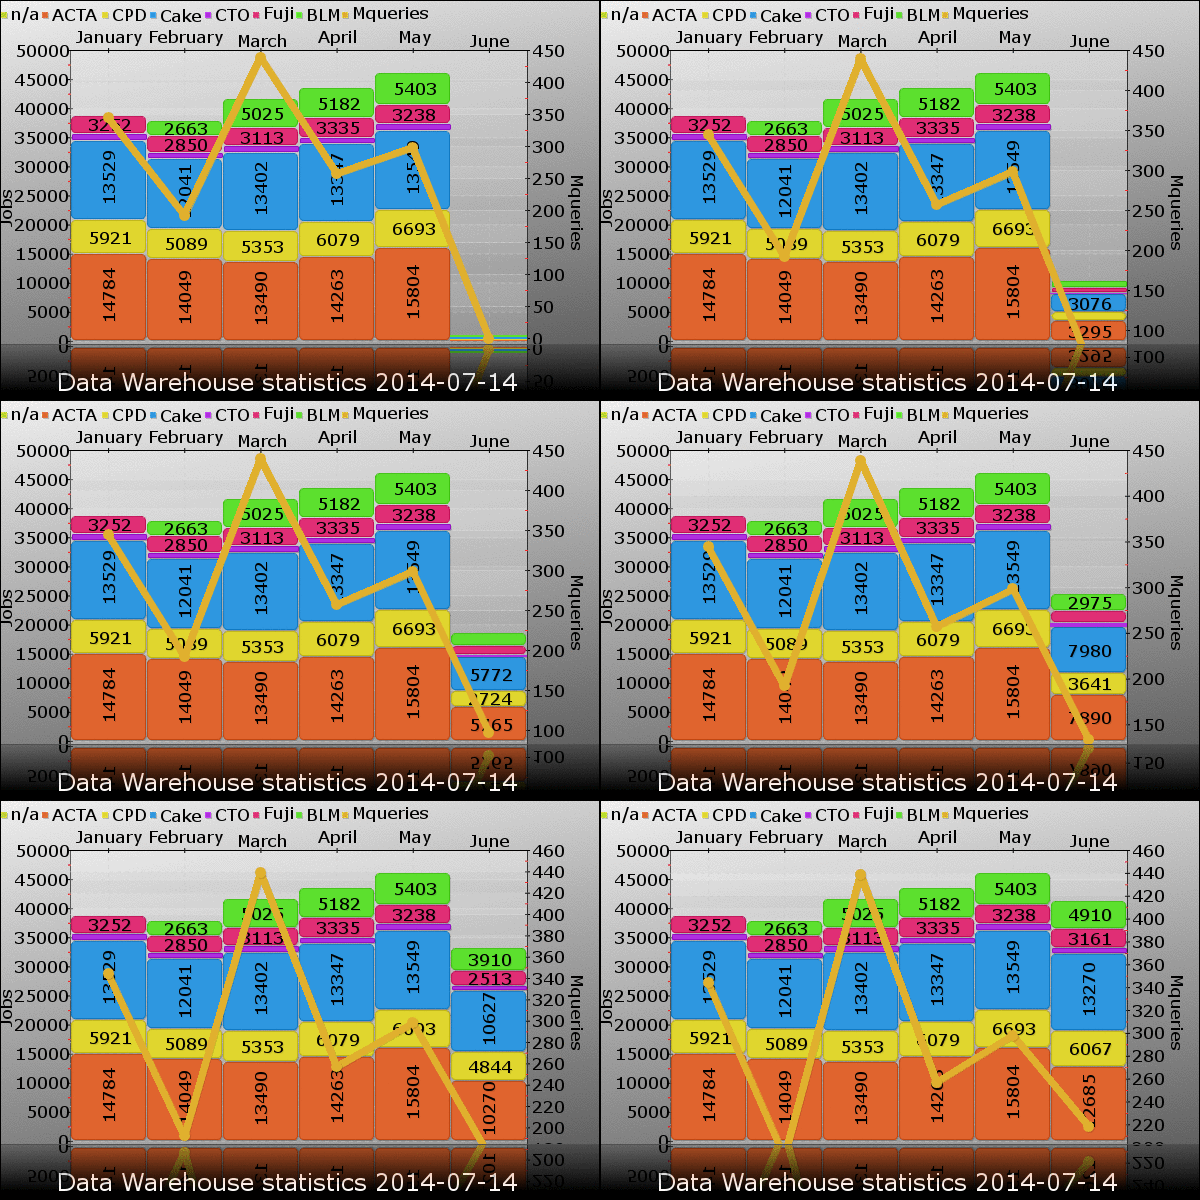
The automated Twitter status message is actually useful for the Data Warehouse maintainers, they can check their twitter device in the morning if there is problems in the Data Warehouse or not. Then I realised I could combine eye candy with twitter and tweet images, still this is a good idea, giving the world a monthly overview of the Data Warehouse activity, it’s not very serious but nice. The automated Twitter workflow is complex and it shows the power of the ITL (integration tag language). I modified the workflow producing the monthly graph, so it produces an animated GIF instead of a static PNG. It is considerably harder to created an animated picture than a static picture, but it was surprisingly simple to do necessary changes in my ITL workflow. First of all there is a hell lot more computations to be done, all intermediate graphs have to calculated and then merged together. My static graph requires 2 SQL queries, the animated graph shown here requires 31 times 2 SQL queries. Before I create the animation I need to create 31 static graphs (one per day) which I fuse together into a ‘month animation’. For the graphs I used pchart2 and for the animation I used imageMagick. All calculations are done in parallel to speed things up.

dwstat.gif

The result is far from perfect it’s just a PoC, and I had to scale down the image to upload it, right-scaled it looks better. But animation is what matters and the graph 'moves'.

The Modified animation ETL script:

The changes done to the original workflow (described here) creating a static graph are few. If you look at the graph you see the moving part is the last month june pillar, it is a compilation of one ‘picture’ a day, so for this graph I have to calculate values for each day in the month, that is done by introducing the <forevery> job iterator a table with 31 rows (determined by the DAYSINMONTH tag). The INTERVAL column is used as a SQL predicate in the jobs crtBarData01 and crtLineData01 (which are run in parallel). The <forevery> iterates the execution of the three nested jobs crtBarData01, crtLineData01 and crtGraph01 once for each day in the month. The parallel and rowdirectory directives will execute all days in parallel independently of each other. All in all we produce 31 graphs in parallel, each throwing 2 SQL requests at MySQL at once and then produce a graph.
When this is done the <exit> tags are executed:
  1. The first <exit> fuse the 31 static graphs together forming an animated gif graph.
  2. The second <exit> inserts a 5 second pause after each animation loop.   
The job monthlyGraph is a neat graph producing package that can be included in another job or schedule with overriding parameters/tags and prereqs. There is some seriously complex computing hidden inside this succinct and simple (if you know ITL) workflow script. The result will not change the world. In the beginning of this post I wrote I created the script just for fun, but that is not really the truth. By stretching concepts you find limitations. With this example I found a bug and a limitation, which both were fixed with less than 10 lines of PHP code.

Unfortunately this is not all you need to know to create animated graphics. The graph above is very large, it should be optimized, this is no simple task. It requires skills, knowledge and practice which I do not have, but I can assure you if I had known five years ago what I now know about graphics rendering I would have had those skills, knowledge and practice. And I would have created a graphics package rivaling the best analytic graphics there is on the market today. That is of course impossible, but graphics is seriously fun, and I have a tendency to be carried away and overdo things, that’s why I believe I would have done it :-)