2014-07-23

Looking for my posts

I recently read a post how to search engine optimize blog posts. I decided to look for my own posts in Google to find out how well my posts were doing in Googles search engine. To my pleasure I found my posts showed up, some even quite high, when I searched for them. But I was a bit saddened to find extracting data from SAP was hard to find, a year ago it was ranked higher but I suppose many posts is written about this subject. (Still I find my post informative, with a practical hands on examples.) By prefixing my search term with 12d (the name of my blog) all my posts I tried showed up, except some data warehouse, no matter how I tried to find it, the post refused to show up in the search result. Other posts of mine showed up, while explicitly searching for some data warehouse but not the post itself. I have checked the post, and I cannot find a reason in the post for not showing up in the search result. The quality is no worse than most of my other posts. No broken links. No explicit language, no controversial anything. It is a mystery to me why the some data warehouse post refuse to show up in the search result.
(Update! I just had to put double quotes around the argument to find my post. There are a lot of "some" + "data" + "warehouse", that is probably the reason why I could not find my post. However the meaning of "some" is different, in the other posts "some" means "unspecified number". I use "some" as in "some chicken", "some data warehouse".)


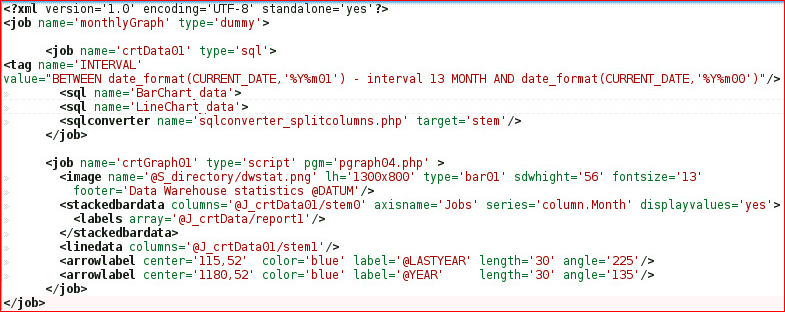
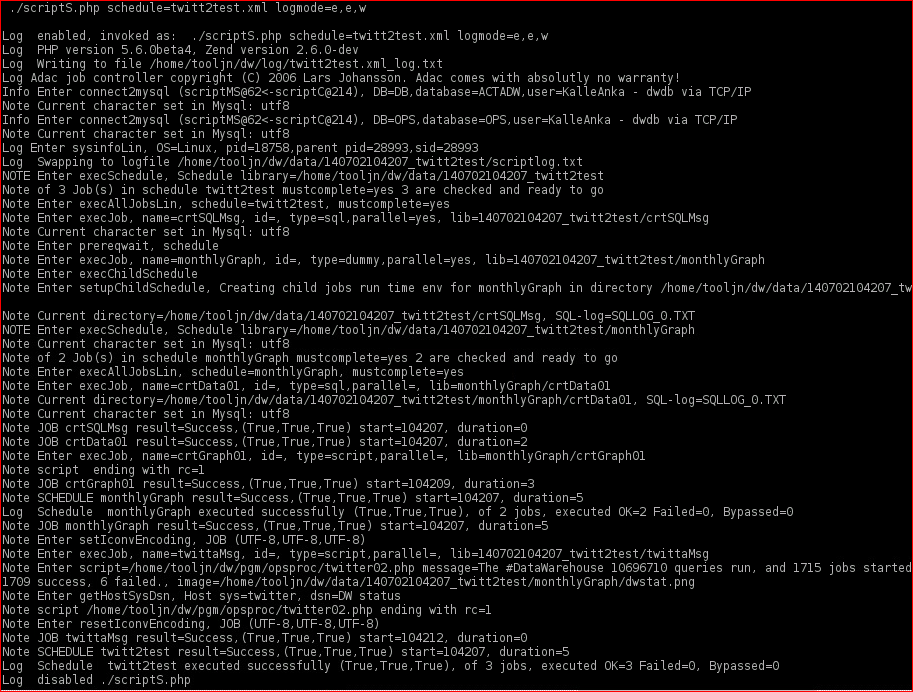
While searching for my own posts I checked how many have read my posts, and the now not so easy to find extracting data from sap was a clear winner with 736 pageviews, with replicating MySQL with Rsync as the runner up 652 pageviews. Not bad at all, even if many readers was not what I had in mind when I started blogging, it is very rewarding you people out there read my posts. Actually I’m mesmerized by the view stats looking at it almost every day. What I think is a bit sad not more than 30 have read my posts on relational big data, I think they are good and worth some minutes of your time. But what is really think is a pity no more than 14 have read php parallel job scheduling 4. This post shows how to parallel process and rightsize business processes like extraction of data from source systems, a complex and advanced post from a different viewpoint from most writings about parallel processing, which typically deals with speeding up the minute atomic parts of computer programs. The entire serie of parallel workflow processing is worth reading, but I suppose very few are interested in this topic, especially when parallel is done in PHP, so 14 pageviews is maybe not that bad:-)

2014-07-15

Animated graphs from the Data Warehouse

Sometimes, rather often actually I got carried away and have a tendency to overdo things of less importance just for the hell of it. This happen less often now than in my younger days, I guess it has to do with age. This post  is about overdoing.
It started with twitter automation and eye candy. So far so good, but then I got this crazy idea, why not animated eye candy, get the graphics moving. This might not be the most useful feature I have created but it was fun to do.
The automated Twitter status message is actually useful for the Data Warehouse maintainers, they can check their twitter device in the morning if there is problems in the Data Warehouse or not. Then I realised I could combine eye candy with twitter and tweet images, still this is a good idea, giving the world a monthly overview of the Data Warehouse activity, it’s not very serious but nice. The automated Twitter workflow is complex and it shows the power of the ITL (integration tag language). I modified the workflow producing the monthly graph, so it produces an animated GIF instead of a static PNG. It is considerably harder to created an animated picture than a static picture, but it was surprisingly simple to do necessary changes in my ITL workflow. First of all there is a hell lot more computations to be done, all intermediate graphs have to calculated and then merged together. My static graph requires 2 SQL queries, the animated graph shown here requires 31 times 2 SQL queries. Before I create the animation I need to create 31 static graphs (one per day) which I fuse together into a ‘month animation’. For the graphs I used pchart2 and for the animation I used imageMagick. All calculations are done in parallel to speed things up.

dwstat.gif

The result is far from perfect it’s just a PoC, and I had to scale down the image to upload it, right-scaled it looks better. But animation is what matters and the graph 'moves'.

The Modified animation ETL script:

The changes done to the original workflow (described here) creating a static graph are few. If you look at the graph you see the moving part is the last month june pillar, it is a compilation of one ‘picture’ a day, so for this graph I have to calculate values for each day in the month, that is done by introducing the <forevery> job iterator a table with 31 rows (determined by the DAYSINMONTH tag). The INTERVAL column is used as a SQL predicate in the jobs crtBarData01 and crtLineData01 (which are run in parallel). The <forevery> iterates the execution of the three nested jobs crtBarData01, crtLineData01 and crtGraph01 once for each day in the month. The parallel and rowdirectory directives will execute all days in parallel independently of each other. All in all we produce 31 graphs in parallel, each throwing 2 SQL requests at MySQL at once and then produce a graph.
When this is done the <exit> tags are executed:
  1. The first <exit> fuse the 31 static graphs together forming an animated gif graph.
  2. The second <exit> inserts a 5 second pause after each animation loop.   
The job monthlyGraph is a neat graph producing package that can be included in another job or schedule with overriding parameters/tags and prereqs. There is some seriously complex computing hidden inside this succinct and simple (if you know ITL) workflow script. The result will not change the world. In the beginning of this post I wrote I created the script just for fun, but that is not really the truth. By stretching concepts you find limitations. With this example I found a bug and a limitation, which both were fixed with less than 10 lines of PHP code.

Unfortunately this is not all you need to know to create animated graphics. The graph above is very large, it should be optimized, this is no simple task. It requires skills, knowledge and practice which I do not have, but I can assure you if I had known five years ago what I now know about graphics rendering I would have had those skills, knowledge and practice. And I would have created a graphics package rivaling the best analytic graphics there is on the market today. That is of course impossible, but graphics is seriously fun, and I have a tendency to be carried away and overdo things, that’s why I believe I would have done it :-)

2014-07-05

Tweet with a graph from the Data Warehouse, take 2

Recently I wrote a post on the updated twitter workflow from the Data Warehouse, publishing a status message each morning. Now a graph is included in the tweet the first day of the month. Not only must workflow steps creating the monthly graph be added, logic to execute these steps once a month must also be provided. The full prototype workflow was included in this post. Here the workflow steps (jobs) have been moved to separate XML scripts, showing the overall logic better.


In this workflow there are three jobs:
  1. crtSQLMsg - creates the Twitter status message
  2. monthlyGraph - creates the monthly graph
  3. twittaMSG - publish the status msg and the monthly graph on Twitter
The tag includeGraph contains a boolean expression which is true when the graph should be included, this tag is then used in the prereq for job monthlyGraph and in the image tag in job twittaMsg, (the function evaluates to the name of the graph or blank if no graph is created).
The jobs crtSQLMsg and twittaMSG has been described in this post and this post, I just added some logic for the monthly graph. (For the tweet itself II use David Grudl’s Twitter for PHP ).

Creating the Graph

I use the pchart2 package creating the graph, the job to create the graph monthlyGraph consists of two nested sub-jobs crtData01 and crtGraph01.    


The crtData01 job creates the data for the graph. (The SQL statements are suppressed, can be found here.) The result is ‘massaged’ by sqlconverter_splitcolumns.php which structures the  result data for pchart2.
The crtGraph01 job calls the php script pgraph04.php which creates the graph. This php script is still a prototype, I’m not happy with parts of the script, I need to produce some more graphs to better understand how to structure the ITL syntax and the underlying php code. But for that I need a demand, contrary to what BI product makers seem to believe users/managers are not that keen on static graphs, users want’s Excel sheets and visual analytics you do with products like Qlikview or Lumira. My intention with these graphics is to please the right side of the brain, more practical for the eye than the intellect. (This is important, but the guys with the money does not always share this opinion.)
I am happy with how neatly this rather complex workflow can be expressed in ITL and how simple it is to create the graph with pchart2.

1st of August 2014  

If you follow the DataWarehouse on Twitter, you will see if the update of the workflow is a success or not. This month twitter rejected the graph complaining the status message was too long. I have shortened the status message but we have to wait and see. (I’m  probably on vacation and may not follow Twitter myself.) There are some glitches in the graph produced in july, hopefully we’ll see an improvement.


This is the log from running the schedule (at top) not creating the Graph:
If you follow the log you can see that the job monthlyGraph is bypassed.


This is the log running the schedule creating the Graph:


I end this post with sqlconverter_splitcolumns.php, (see crtData01 above):
<?php
/**
* SQL result converter - dynamically included in function {@link execSql()}
*
* This converter converts SQL select(s) result to an array targetet for the {@link http://www.pchart.net/ pchart program product}
* Note! First we call {@link sqlconverter_default.php} to create a result php array, then transform the array
* into something pchart can digest.
* Syntax:
*<sqlconverter> <br>
* <name>sqlconverter_splitcolumns.php</name> <br>
* <target>table</target> <br>
* <delim>,</delim> <br>
*</sqlconverter>
*
* @see sqlconverter_default.php
* @author Lasse Johansson <lars.a.johansson@se.atlascopco.com>
* @version  1.0.0
* @package adac
* @subpackage sqlconverter
*/
$sqllog->enter('Note',"sqlconverter_splitcolumns.php meta=$metafile,sql=$sqltarget");
$mysqltarget = $sqltarget;
$sqltarget = $temparr = 'column0';
/** Include the default converter to do a basic conversion of the result table */
include("$sqlconverterDir".'sqlconverter_default.php');
$sqltarget = $mysqltarget;
if(is_numeric(substr($sqltarget, -1,1))) {
$sqltarget = "$sqltarget";
} else {
clearstatcache();
for ($x=0; 1==1; $x++){
 if (!file_exists("$sqltarget$x")){
   $sqltarget = "$sqltarget$x";
   break;
 }
}
}
$sqlarray = unserialize(file_get_contents("$temparr"));
$xtab = $xmlconverter['xtab'] == 'yes' ? TRUE : FALSE;
if($xtab) {
 $XTAB = [];
 foreach($sqlarray as $row){
     $k = array_keys($row);
     $v = array_values($row);
     $XTAB[] = [$k[0] => $v[0],$v[1] => $v[2]];
 }
 $sqlarray = $XTAB;
 unset($XTAB);
}
$STEM = [];
foreach($sqlarray as $row){
 foreach($row as $coln => $colv){
   $STEM["$coln"][] = "$colv";
 }
}
unset ($STEM["rowindex"]);
if($xtab) $STEM[$k[0]] = array_unique($STEM[$k[0]]);
file_put_contents("$sqltarget",serialize($STEM));

2014-07-01

Tweets with a graph from the Data Warehouse.

This morning; with some problems the Data Warehouse twote an image. The image is a graph with operations statistics from the Data Warehouse. If you look closely you can see the tweet is not without faults. The intention is to add the graph the first of the month, giving a picture of the Data Warehouse progression in terms of jobs and SQL queries. I hope to fix the errors and write a post how this automatic tweets work. For now you can study the current ITL workflow with it’s glitches.


<?xml version='1.0' encoding='UTF-8' standalone='yes'?>
<schedule mustcomplete='yes' logmsg='Publish last @hours hours job activity on Twitter @tooljn'>
 <variant name='hours' default='24' cmnt='runtime parameter'/>

 <tag name='includeGraph' value='(date("j") == 1)'/> <!-- boolean expression used below (1st day in month) -->
   
 <job name='crtSQLMsg' type='sql'>
   <tag name='YNOW' value="subtime(now(),'@hours:00:00')" cmnt='The last @hours hours'/>
   <sql>
     use OPS;
     select  STAT.queries as 'queries', 'queries run, and'
     ,sum(UTABS.jobs) as jobs,'jobs started since',@YNOW as YTIME
     , sum(UTABS.success) as success,'success,', sum(UTABS.failure) as failure,'failed,'
     , jobs -(success + failure) as running, 'executing.'
     from (
     SELECT count(*) jobs, sum(if(result=1,1,0)) as success,sum(if(result=1,0,1)) as failure
FROM OPS.`job`
WHERE  started > @YNOW
union all
SELECT count(*) jobs, sum(if(result=1,1,0)) as success,sum(if(result=1,0,1)) as failure
FROM CPD_OPS.`job`
WHERE  started > @YNOW
union all
SELECT count(*) jobs, sum(if(result=1,1,0)) as success,sum(if(result=1,0,1)) as failure
FROM CAKE_OPS.`job`
WHERE  started > @YNOW
union all
SELECT count(*) jobs, sum(if(result=1,1,0)) as success,sum(if(result=1,0,1)) as failure
FROM CTO_OPS.`job`
WHERE  started > @YNOW
union all
SELECT count(*) jobs, sum(if(result=1,1,0)) as success,sum(if(result=1,0,1)) as failure
FROM FUJI_OPS.`job`
WHERE  started > @YNOW
union all
SELECT count(*) jobs, sum(if(result=1,1,0)) as success,sum(if(result=1,0,1)) as failure
FROM BLM_OPS.`job`
WHERE  started > @YNOW
     ) as UTABS  join
 (select sum(queries) as queries from OPS.mysqlstat01 WHERE time > @YNOW) as STAT
     ;
   </sql>
   <sqlconverter name='sqlconverter_CSV.php' target='report0' delim='space' enclosed='' headers='no'/>
 </job>
 
 <job name='monthlyGraph' type='dummy'>
     <prereq type='boolean'>@includeGraph</prereq>
     <job name='crtData01' type='sql'>  
<sql name='BarChart_data'>
 use test;    
 select A.Month,A.jobs as ACTA, B.jobs as CPD, C.jobs Cake, D.jobs CTO, E.jobs Fuji, F.jobs BLM
 from
 (SELECT date_format(started,'%Y%m') YYMM,date_format(started,'%M') Month, count(*) jobs
 FROM OPS.`job`
 where date(started) >date_format(CURRENT_DATE,'%Y%m01') - interval 1 YEAR
 group by date_format(started,'%Y%m')) A left join

 (SELECT date_format(started,'%Y%m') YYMM,date_format(started,'%M') Month, count(*) jobs
 FROM CPD_OPS.`job`
 where date(started) >date_format(CURRENT_DATE,'%Y%m01') - interval 1 YEAR
 group by date_format(started,'%Y%m')) B on B.YYMM = A.YYMM left join

 (SELECT date_format(started,'%Y%m') YYMM,date_format(started,'%M') Month, count(*) jobs
 FROM CAKE_OPS.`job`
 where date(started) >date_format(CURRENT_DATE,'%Y%m01') - interval 1 YEAR
 group by date_format(started,'%Y%m')) C on C.YYMM = A.YYMM left join

 (SELECT date_format(started,'%Y%m') YYMM,date_format(started,'%M') Month, count(*) jobs
 FROM CTO_OPS.`job`
 where date(started) >date_format(CURRENT_DATE,'%Y%m01') - interval 1 YEAR
 group by date_format(started,'%Y%m')) D on D.YYMM = A.YYMM left join

 (SELECT date_format(started,'%Y%m') YYMM,date_format(started,'%M') Month, count(*) jobs
 FROM FUJI_OPS.`job`
 where date(started) >date_format(CURRENT_DATE,'%Y%m01') - interval 1 YEAR
 group by date_format(started,'%Y%m')) E on E.YYMM = A.YYMM left join

 (SELECT date_format(started,'%Y%m') YYMM,date_format(started,'%M') Month, count(*) jobs
 FROM BLM_OPS.`job`
 where date(started) >date_format(CURRENT_DATE,'%Y%m01') - interval 1 YEAR
 group by date_format(started,'%Y%m')) F on F.YYMM = A.YYMM;
</sql>  
<sql name='LineChart_data'>
 select  B.queries Mqueries
 from
 (SELECT date_format(started,'%Y%m') YYMM,date_format(started,'%M') Month, count(*) jobs
 FROM OPS.`job`
 where date(started) >date_format(CURRENT_DATE,'%Y%m01') - interval 1 YEAR
 group by date_format(started,'%Y%m')) A left join

 (select date_format(time,'%Y%m') YYMM,date_format(time,'%Y%m'), round(sum(queries) / 1000000) as queries
 from OPS.mysqlstat01
 where date(time) >date_format(CURRENT_DATE,'%Y%m01') - interval 1 YEAR
 group by date_format(time,'%Y%m')) B on B.YYMM = A.YYMM
</sql>
<sqlconverter name='sqlconverter_splitcolumns.php' target='stem'/>
     </job>
     <job name='crtGraph01' type='script' pgm='pgraph04.php' >
<image name='@S_directory/dwstat.png' lh='1300x800' type='bar01' sdwhight='56' fontsize='13'
     footer='Data Warehouse statistics - @MONTH'/>
<stackedbardata columns='@J_crtData01/stem0'  axisname='Jobs' series='column.Month' displayvalues='yes'>
 <labels array='@J_crtData/report1'/>
</stackedbardata>
<linedata columns='@J_crtData01/stem1'/>
<arrowlabel center='1175,52' color='blue' label='@LASTMONTH' length='40' angle='135'/>
     </job>
 </job>

 <job name='twittaMsg' include='twitter.xml'>
     <tag name='MESSAGE' file='@J_crtSQLMsg/report0.CSV'/>
     <tag name='TWEET' value='The #DataWarehouse @MESSAGE'/>
     <tag name='image'><function>return @includeGraph ? '@J_monthlyGraph/dwstat.png' : '';</function></tag>
 </job>
</schedule>